Most retail networks still run on one national plan: one allocation, one assortment, one promotional calendar. But customers do not shop nationally. They shop in a particular store, in a particular catchment, around particular occasions. This insight deck sets out what that gap costs, the evidence we gathered from real shoppers, and how a retailer can turn one national network into hundreds of locally tuned stores.
Retail planning needs a local lens
Four structural shifts make a uniform, national approach increasingly difficult.
- ·Fragmented demand. Buying peaks around occasions, collections and festivals. National averages obscure local behaviour.
- ·Faster planning cycles. In-season sell-through is replacing fixed seasonal buys. Reallocation has to respond quickly.
- ·Analytics as standard. POS, footfall, loyalty and local demographics increasingly inform allocation decisions.
- ·Structural margin pressure. Discount-led demand and input-cost inflation continue to squeeze full-price sell-through.
The starting point is to test what customers actually experience before prescribing technology.
Let customer evidence lead
Analytics should validate retail judgement with real customer and store observations, not replace it. Store experience, personalisation and staff interaction shape purchasing, and better insight strengthens both conversion and long-term loyalty. Data supports retail expertise; it does not replace it.
We build the evidence base in three steps:
- ·Observe: store visits and shop-floor observations. Layouts, merchandising, size availability and store-specific issues.
- ·Ask: customer survey. Recent shoppers across cities, covering experience, availability and channel preferences.
- ·Quantify: live evidence dashboard. Size gaps, lost sales, experience and channel metrics before any rollout.
The sequence is always validate, then prioritise, then pilot.
A fast read on real shopping habits
We ran a short 18-question survey across eight branches in Karachi and Lahore between 12 and 15 September 2026. It covered shopper profile, visit frequency, product and size availability, design relevance, navigation, staff, motivation and overall rating.
The sample was recent shoppers, 90% in Karachi and 10% in Lahore, predominantly younger customers who shop in store. The results show directional patterns rather than a network-wide estimate, and the gaps they surface should be tested against POS, inventory and store-level data.
- ·87% of respondents are aged 18 to 34
- ·80% shop mainly in store
- ·77% favour the Women's Pret range
- ·47% shop only during sales or festivals
The customer is engaged. Demand is uneven.
Store experience scores are positive, while buying remains highly occasion- and promotion-led.
- ·83% rate the store good or excellent
- ·83% find stores easy to navigate
- ·70% are satisfied with store staff
- ·80% use stores as their main channel
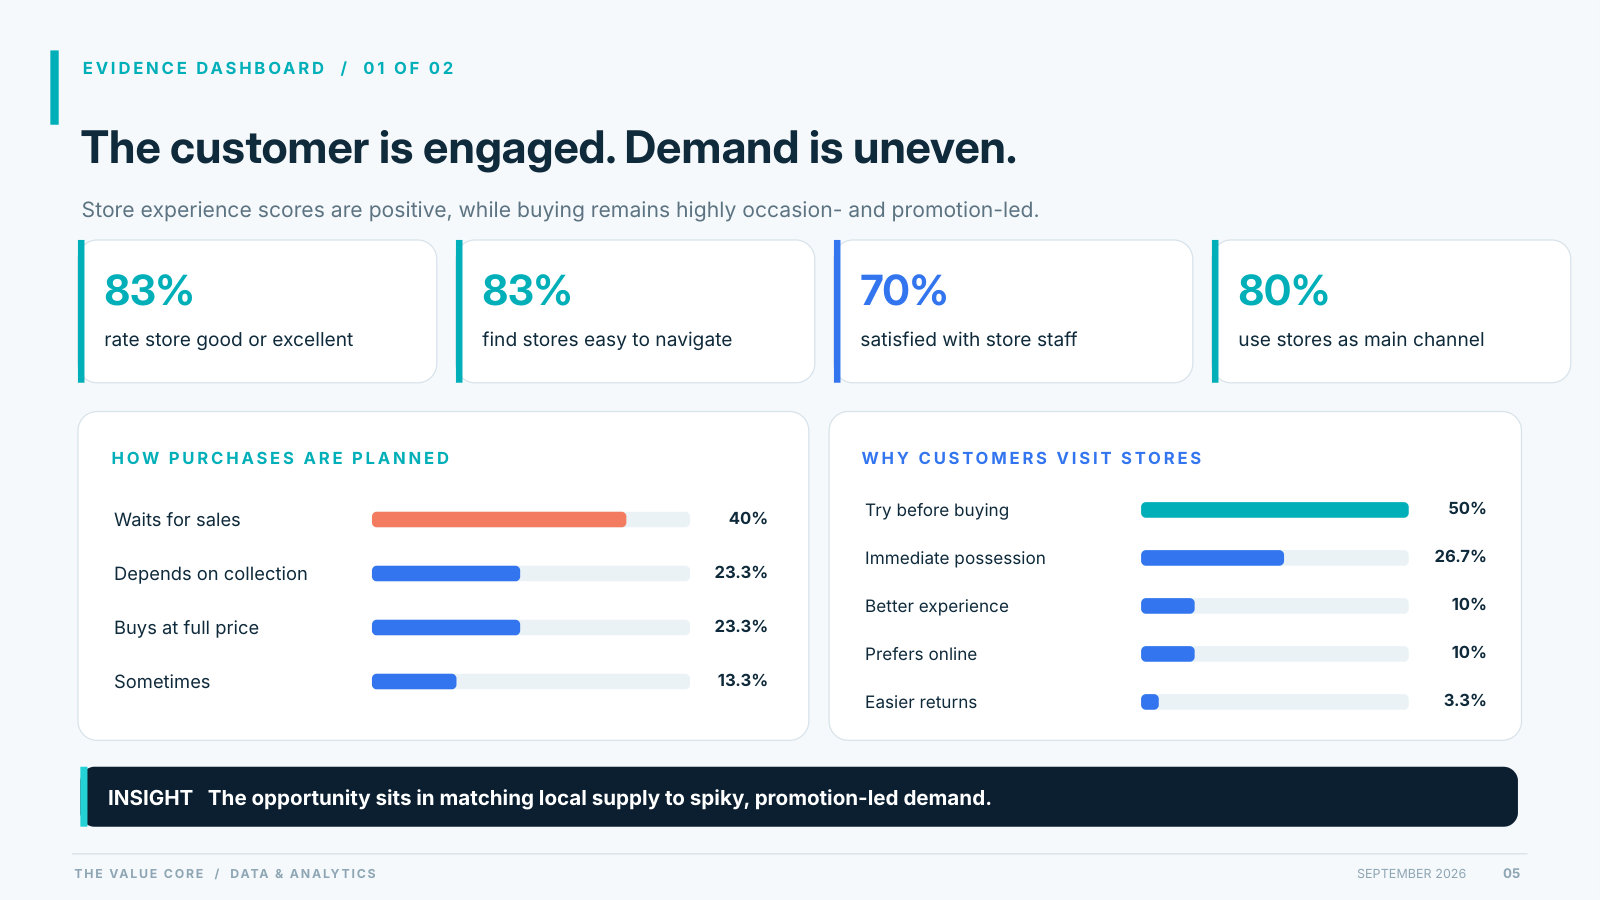
How purchases are planned: 40% wait for sales, 23.3% say it depends on the collection, 23.3% buy at full price and 13.3% sometimes wait.
Why customers visit stores: 50% want to try before buying, 26.7% want the item immediately, 10% come for a better experience, 10% would rather shop online and 3.3% value easier returns.
The opportunity sits in matching local supply to spiky, promotion-led demand.
Stock gaps translate into lost sales
Customers who cannot find a size or item frequently leave without buying.
- ·37% leave without buying
- ·53% miss their desired size
- ·43% do not fully find what they came for
- ·87% say the assortment varies by branch
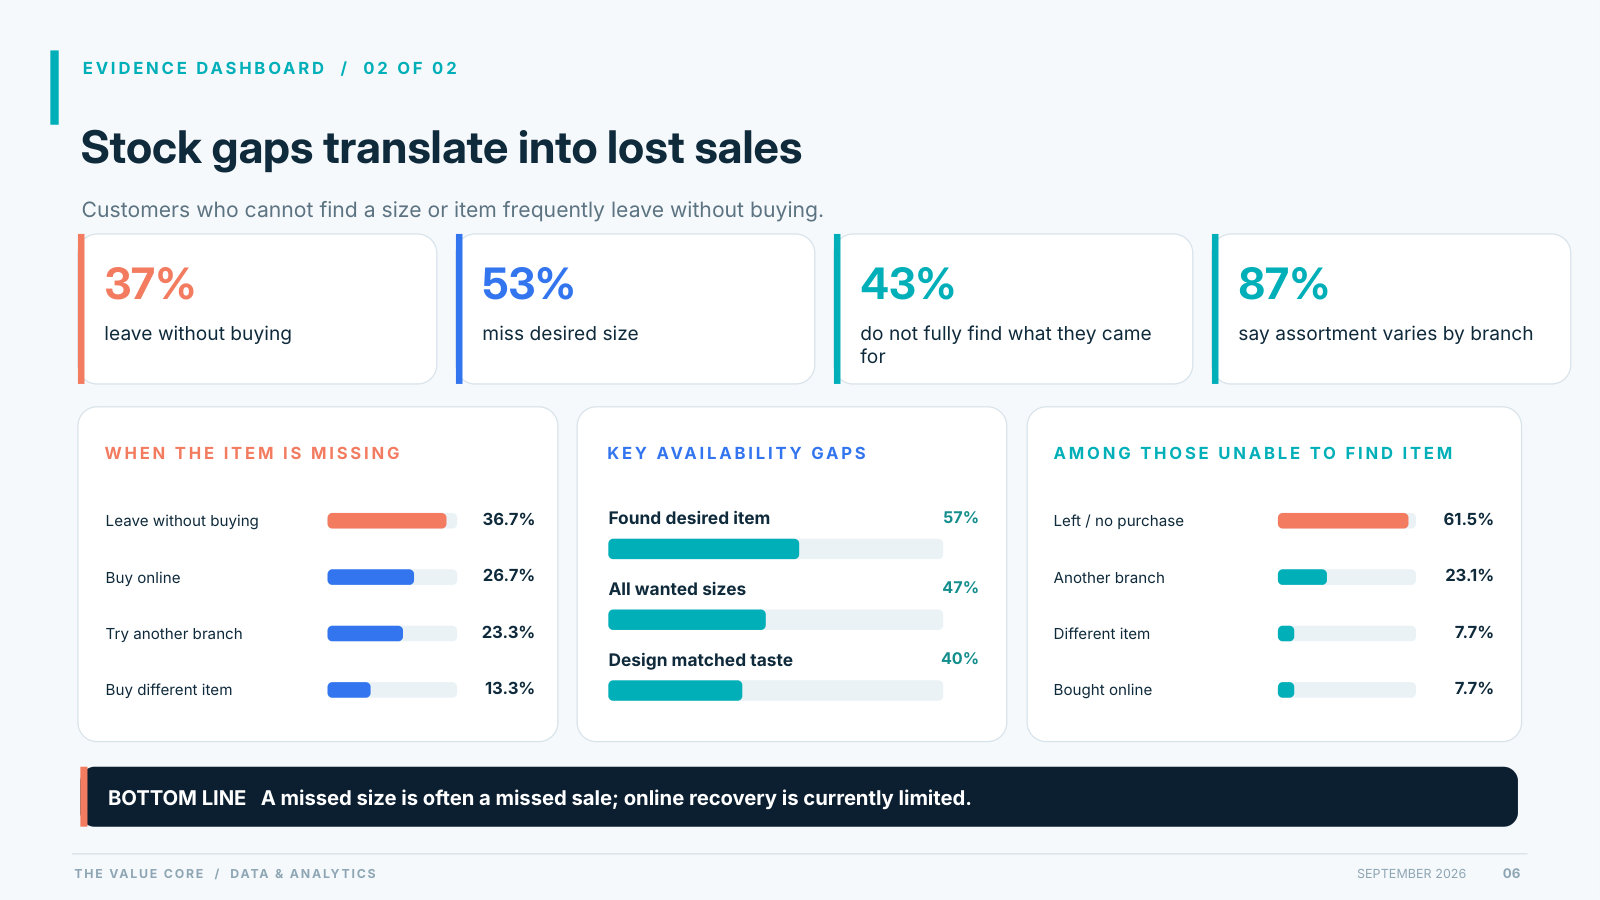
When the item is missing, 36.7% leave without buying, 26.7% buy online, 23.3% try another branch and 13.3% buy a different item.
Key availability gaps: only 57% found the item they wanted, 47% found all the sizes they wanted, and 40% said the designs matched their taste.
Among those unable to find an item, 61.5% left without a purchase, 23.1% went to another branch, 7.7% bought a different item and 7.7% bought online.
The bottom line: a missed size is often a missed sale, and online recovery is currently limited.
Three gaps, three measurable pilots
Each test starts with one store cluster and is measured against a live baseline.
Size availability (53% miss their size, 37% walk away). Store × SKU × size forecasting and size-curve optimisation for the Women's Pret range. Proof: availability and walk-away rate against a control cluster.
Local assortment (87% see branch variation, 40% find designs match their taste). Catchment-led assortment using footfall, loyalty and local socio-economic data. Proof: sell-through and full-price mix against uniform allocation.
Promotion sensitivity (47% shop only during sales or festivals). Promotion-aware forecasts and targeted store-level offers. Proof: retained margin and uplift in full-price festival sales.
A controlled pilot proves the economics before anyone commits to network-wide change.
From reporting to autonomous decisions
Capability maturity is a deliberate climb: describe, explain, predict, optimise, act.
- ·Report: what happened?
- ·Analyse: why did it happen?
- ·Predict: what happens next?
- ·Optimise: what should we do?
- ·Act: humans steer; systems act.
Capability 1: store-level demand and dynamic allocation
Put the right SKU, size and colour in the right store, before it ships.
The operational challenge. One central allocation plan misses catchment-level demand and size differences. Best-sellers stock out in busy stores while slow movers accumulate elsewhere. Inventory is deployed reactively, after lost sales or markdowns emerge.
What TVC delivers:
- ·Micro-level forecasting. Forecast at store × SKU × size using POS, footfall, promotions and local signals.
- ·Dynamic allocation engine. Set branch-specific quantities before shipping, weighted to real demand.
- ·Availability guardrails. Protect winning items and redirect slow-moving stock to stronger stores.
Method: sales, inventory, footfall and demographic data feed a demand model, which drives allocation rules.
Outcome: more full-price sales, fewer stockouts and better working capital.
Capability 2: make every store a measurable asset
Combine vision, customer signals and location intelligence to improve conversion.
The operational challenge. Layout, footfall and customer movement are seldom linked to commercial performance. High-attention displays can under-convert without a clear diagnostic. Experience and staff interaction are evaluated more by intuition than evidence.
What TVC delivers:
- ·AI-powered store intelligence. Footfall, heat maps, customer journeys, dwell time and service metrics.
- ·Customer experience intelligence. Connect staff interaction, feedback and operations to basket, conversion and loyalty.
- ·Location and market intelligence. Align assortment and pricing tiers with catchment demographics and purchasing power.
Method: store video, POS, feedback, loyalty and geography combine into conversion and layout intelligence.
Outcome: stronger conversion, better store layouts and higher revenue per square foot.
Capability 3: bring online and in-store demand together
Understand where each channel wins by location, demographic and segment.
The operational challenge. Online and physical stores are often reviewed in separate data silos. Store expansion decisions do not always reflect actual digital demand by geography. Age and customer segment influence channel choice, not just location.
What TVC delivers:
- ·Geographic channel mix. Identify where online demand dominates and where stores merit investment.
- ·Segment-level preferences. Measure channel patterns by age, geography and customer profile.
- ·Unified customer journey. Join web, app and physical-store signals into one measurable path to purchase.
Method: online and offline transactions plus demographics reveal segment channel choice, which sets growth priorities.
Outcome: better conversion and more disciplined store investment.
How TVC engages: prove value first, scale what works
An evidence-led diagnostic, one controlled pilot, then phased deployment and handover.
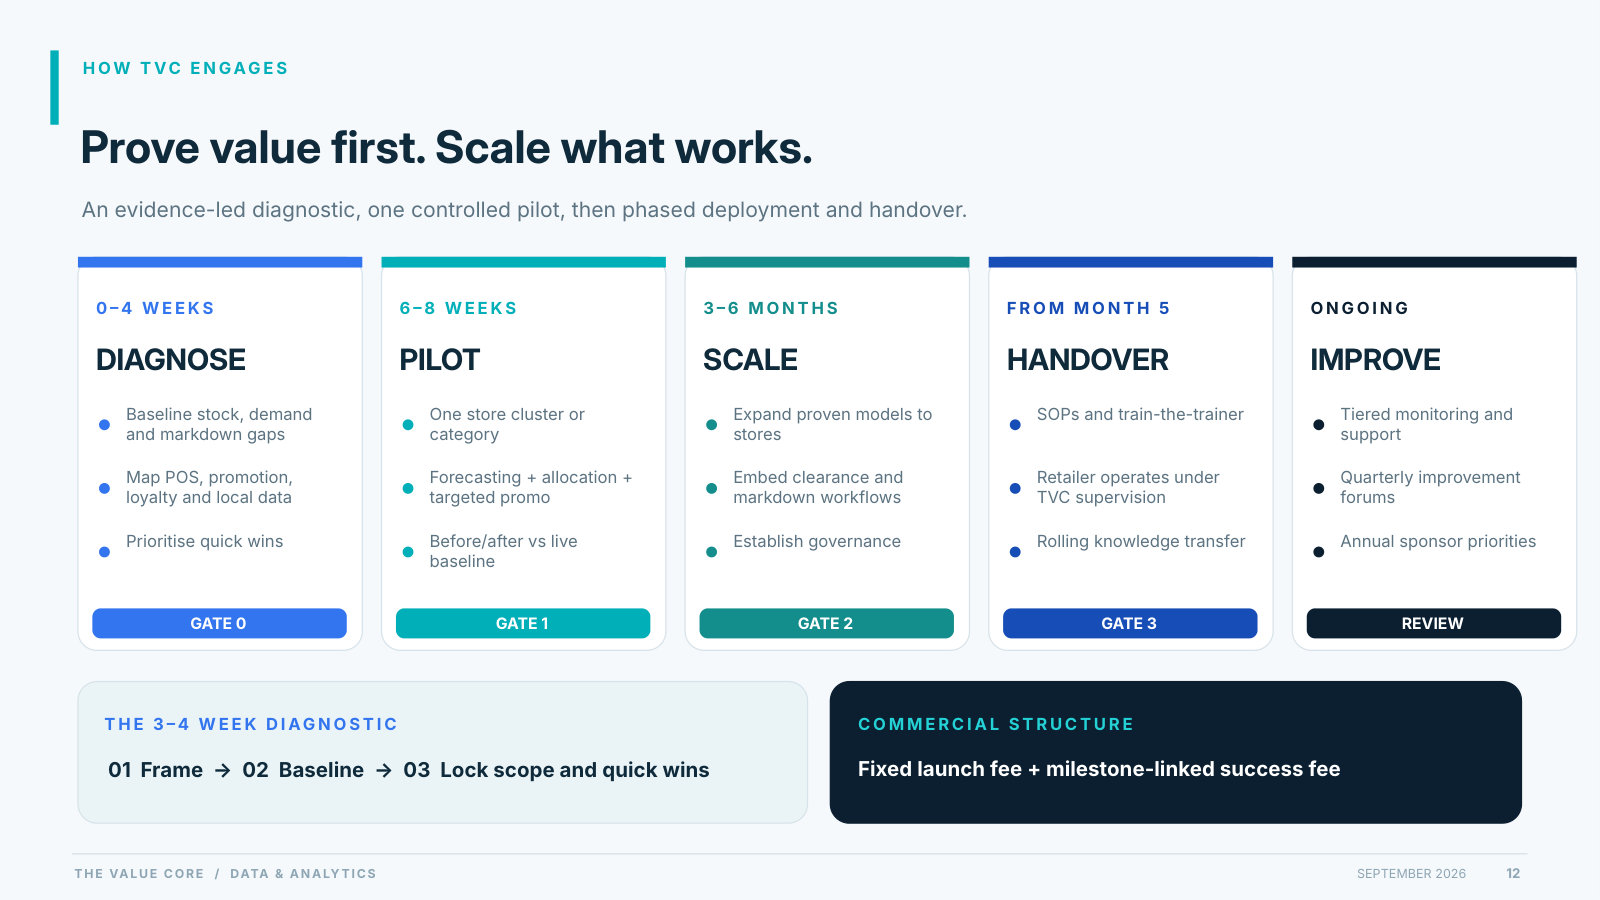
- ·Diagnose (0 to 4 weeks). Baseline stock, demand and markdown gaps; map POS, promotion, loyalty and local data; prioritise quick wins. Gate 0.
- ·Pilot (6 to 8 weeks). One store cluster or category; forecasting, allocation and targeted promotion; before-and-after measurement against a live baseline. Gate 1.
- ·Scale (3 to 6 months). Expand proven models across stores; embed clearance and markdown workflows; establish governance. Gate 2.
- ·Handover (from month 5). SOPs and train-the-trainer; the retailer operates under TVC supervision; rolling knowledge transfer. Gate 3.
- ·Improve (ongoing). Tiered monitoring and support, quarterly improvement forums and annual sponsor priorities.
The 3 to 4 week diagnostic runs in three steps: frame, baseline, then lock scope and quick wins. Commercially, engagements combine a fixed launch fee with a milestone-linked success fee.